Debugging
Index
Debugging in-game with the state chart debugger
![]() When the game is running it is very useful to see the current state of the state chart for debugging purposes. For this, this library contains a state chart debugger that you can add to your scene. You can add it to your scene by pressing the “Instantiate child scene” icon above the node tree and then looking for “debugger”:
When the game is running it is very useful to see the current state of the state chart for debugging purposes. For this, this library contains a state chart debugger that you can add to your scene. You can add it to your scene by pressing the “Instantiate child scene” icon above the node tree and then looking for “debugger”:
The debugger is a control node that you can position anywhere in your scene where it makes sense (maybe you already have an in-game debugging screen where you can add it). Since it is a control it can easily be integrated into an existing UI.
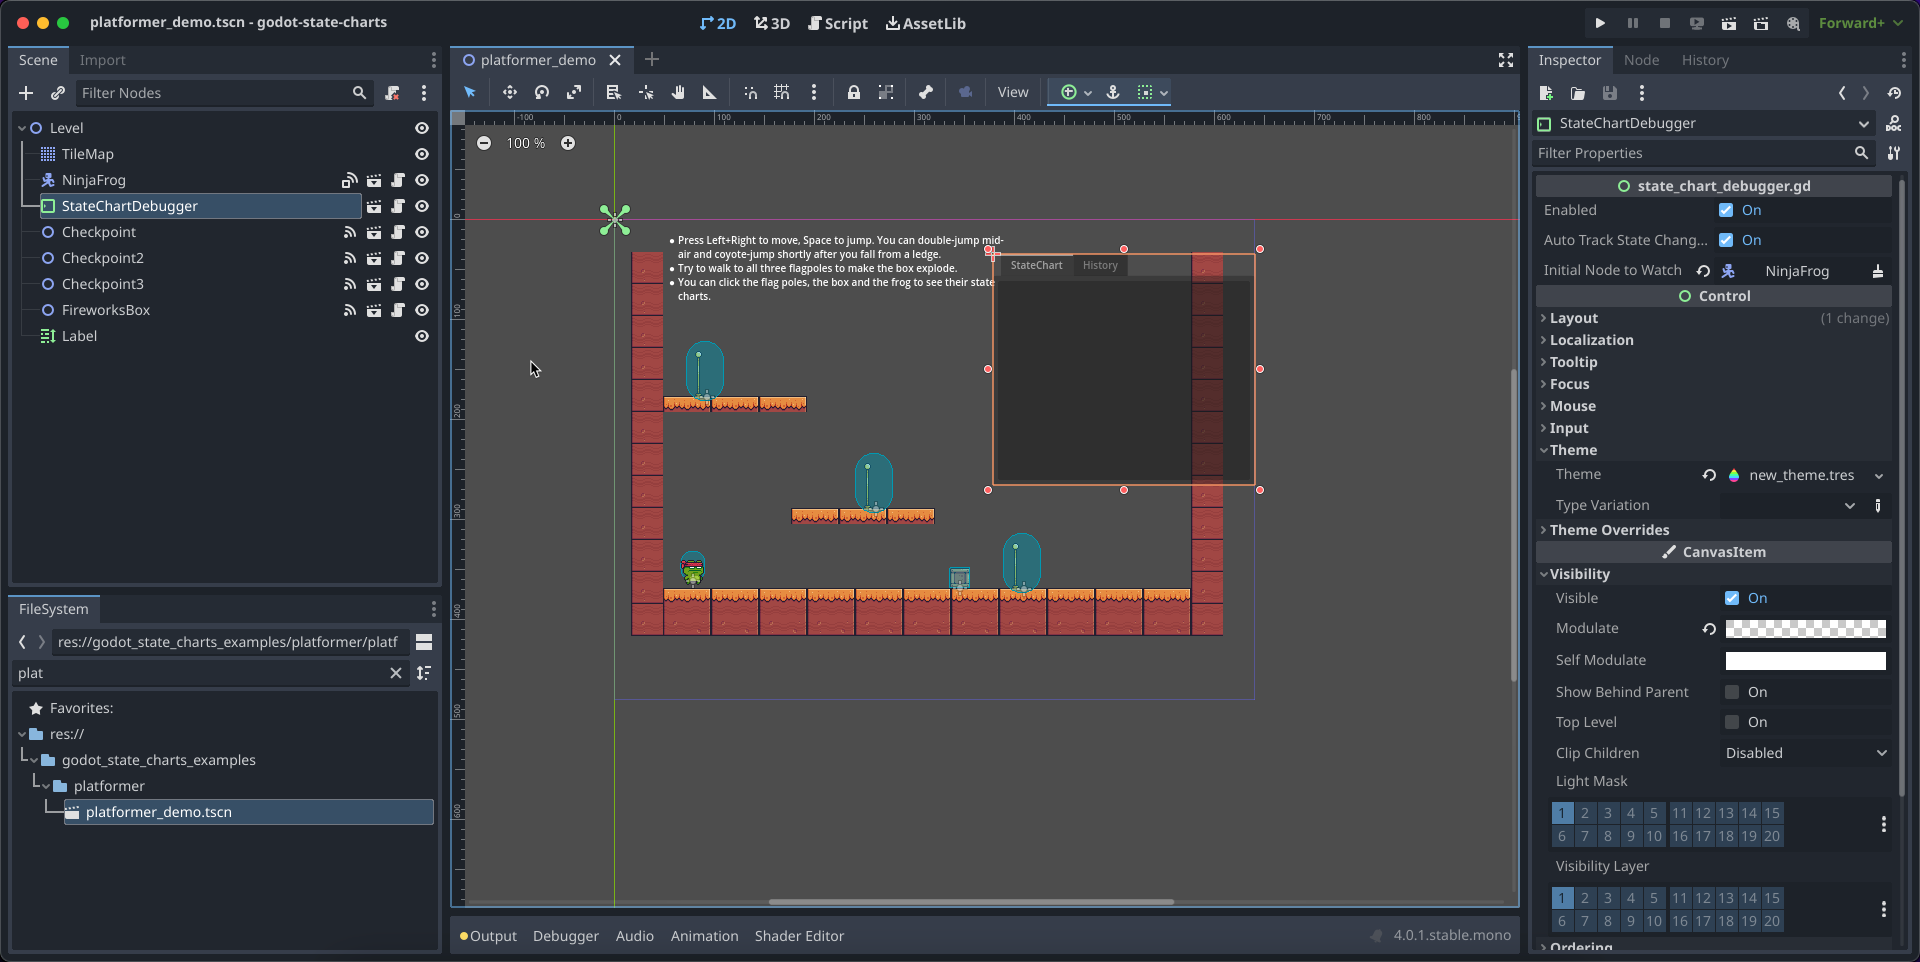
The state chart debugger has a property Initial node to watch where you can set a node that should be watched. It doesn’t necessarily need to be a state chart node, the debugger will search for a state chart anywhere below the node you set. This is useful when you have the state chart nested in a sub-scene and you want to watch the state chart from the root scene where you don’t have access to the state chart node.
You can also use the debug_node function of the state chart debugger to change the node that is being watched at runtime. For example you could add code that changes the debugged node when clicking on a unit or object in your game
@onready var debugger: StateChartDebugger = $StateChartDebugger

func _on_unit_clicked(unit):
    debugger.debug_node(unit)
In C# there is another wrapper class StateChartDebugger which you can use to interact with the debugger. You can get an instance of this class by calling the StateChartDebugger.Of function:
using Godot;
using GodotStateCharts;

public class MyNode : Node
{
    private StateChartDebugger debugger;

    public override void _Ready()
    {
        // get the debugger node and wrap it in a type-safe wrapper
        debugger = StateChartDebugger.Of(GetNode("StateChartDebugger"));
    }

    private void OnUnitClicked(Node unit)
    {
        // change the node that is being watched by the debugger
        debugger.DebugNode(unit);
    }
}
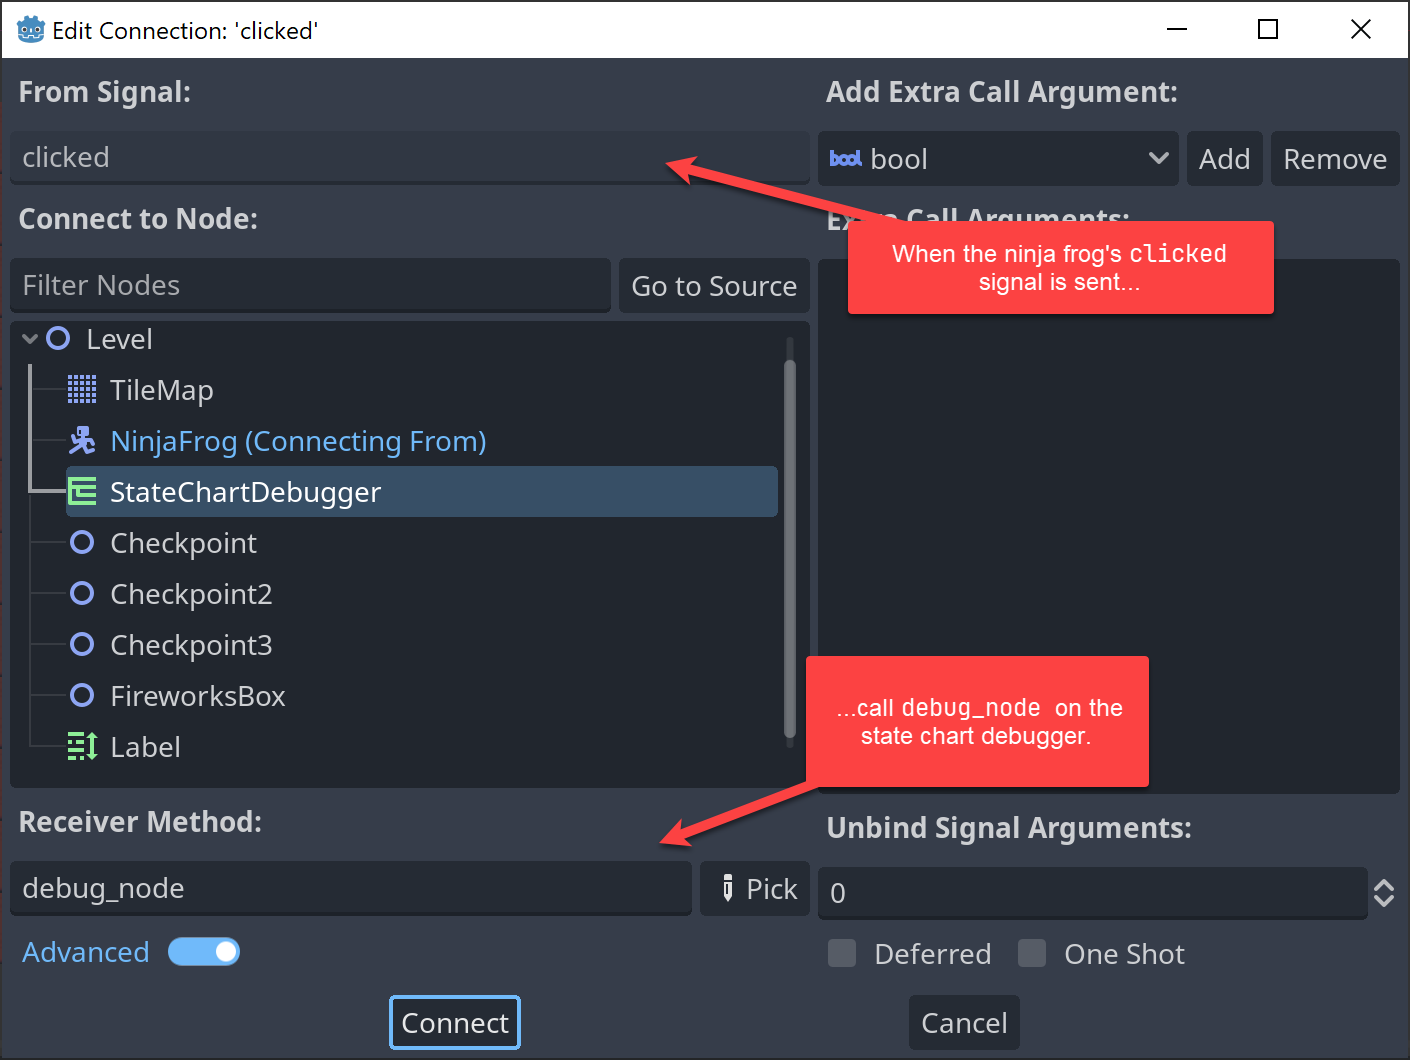
Another option is to directly use built-in signals and set the node to debug in the editor UI. This is how it was done in the example projects:
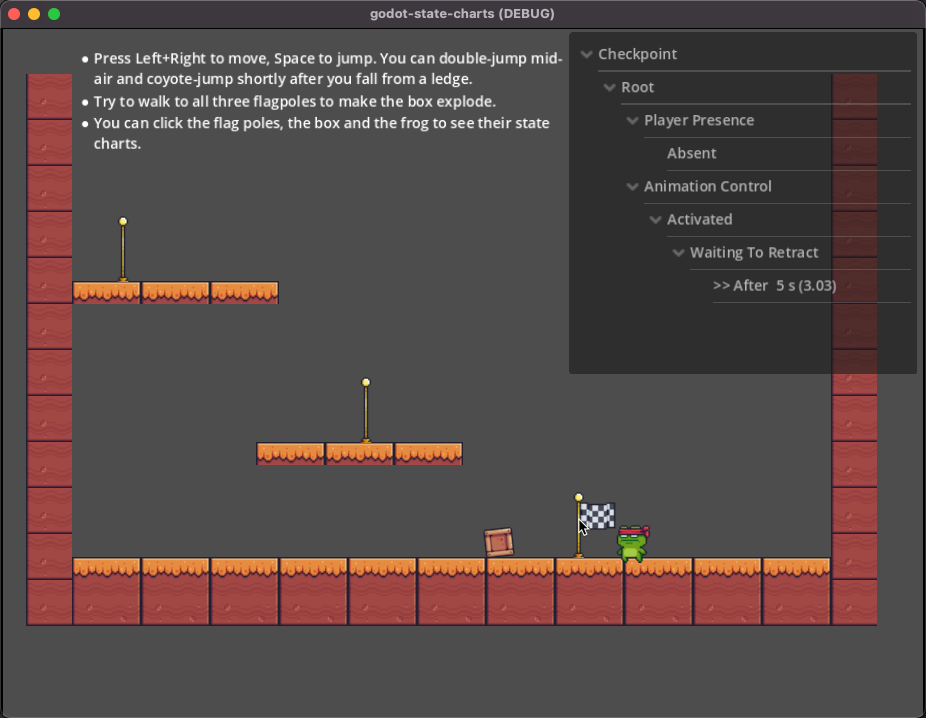
At runtime, the state chart debugger will show the current state of the state chart, including all currently set expression properties. It also indicates time left for delayed transitions, so you have a good overview of what is going on in your state chart.
By default, the state chart debugger will track state changes in the state chart it watches and print them into the “History” tab. This way you can see which state transitioned into which state and when.
![]()
You can add custom lines into the history by calling the add_history_entry function. This is useful if you want to have additional information in the history.
debugger.add_history_entry("Player died")
The C# wrapper also provides a AddHistoryEntry function which you can use to add custom entries to the history.
debugger.AddHistoryEntry("Player died");
The debugger will only track state changes of the currently watched state chart. If you connect the debugger to a different state chart, it will start tracking the state changes of the new state chart.
If you want to disable the history tracking, you can unset the Auto Track State Changes checkbox in the editor UI.
Debugging in the editor
⚠️ Note: this feature is currently in preview and may still have some rough edges. Please report any issues you encounter.
Starting with version 0.10.0 the plugin contains an in-editor debugger, which shows the current state of any tracked state chart in the currently running game.
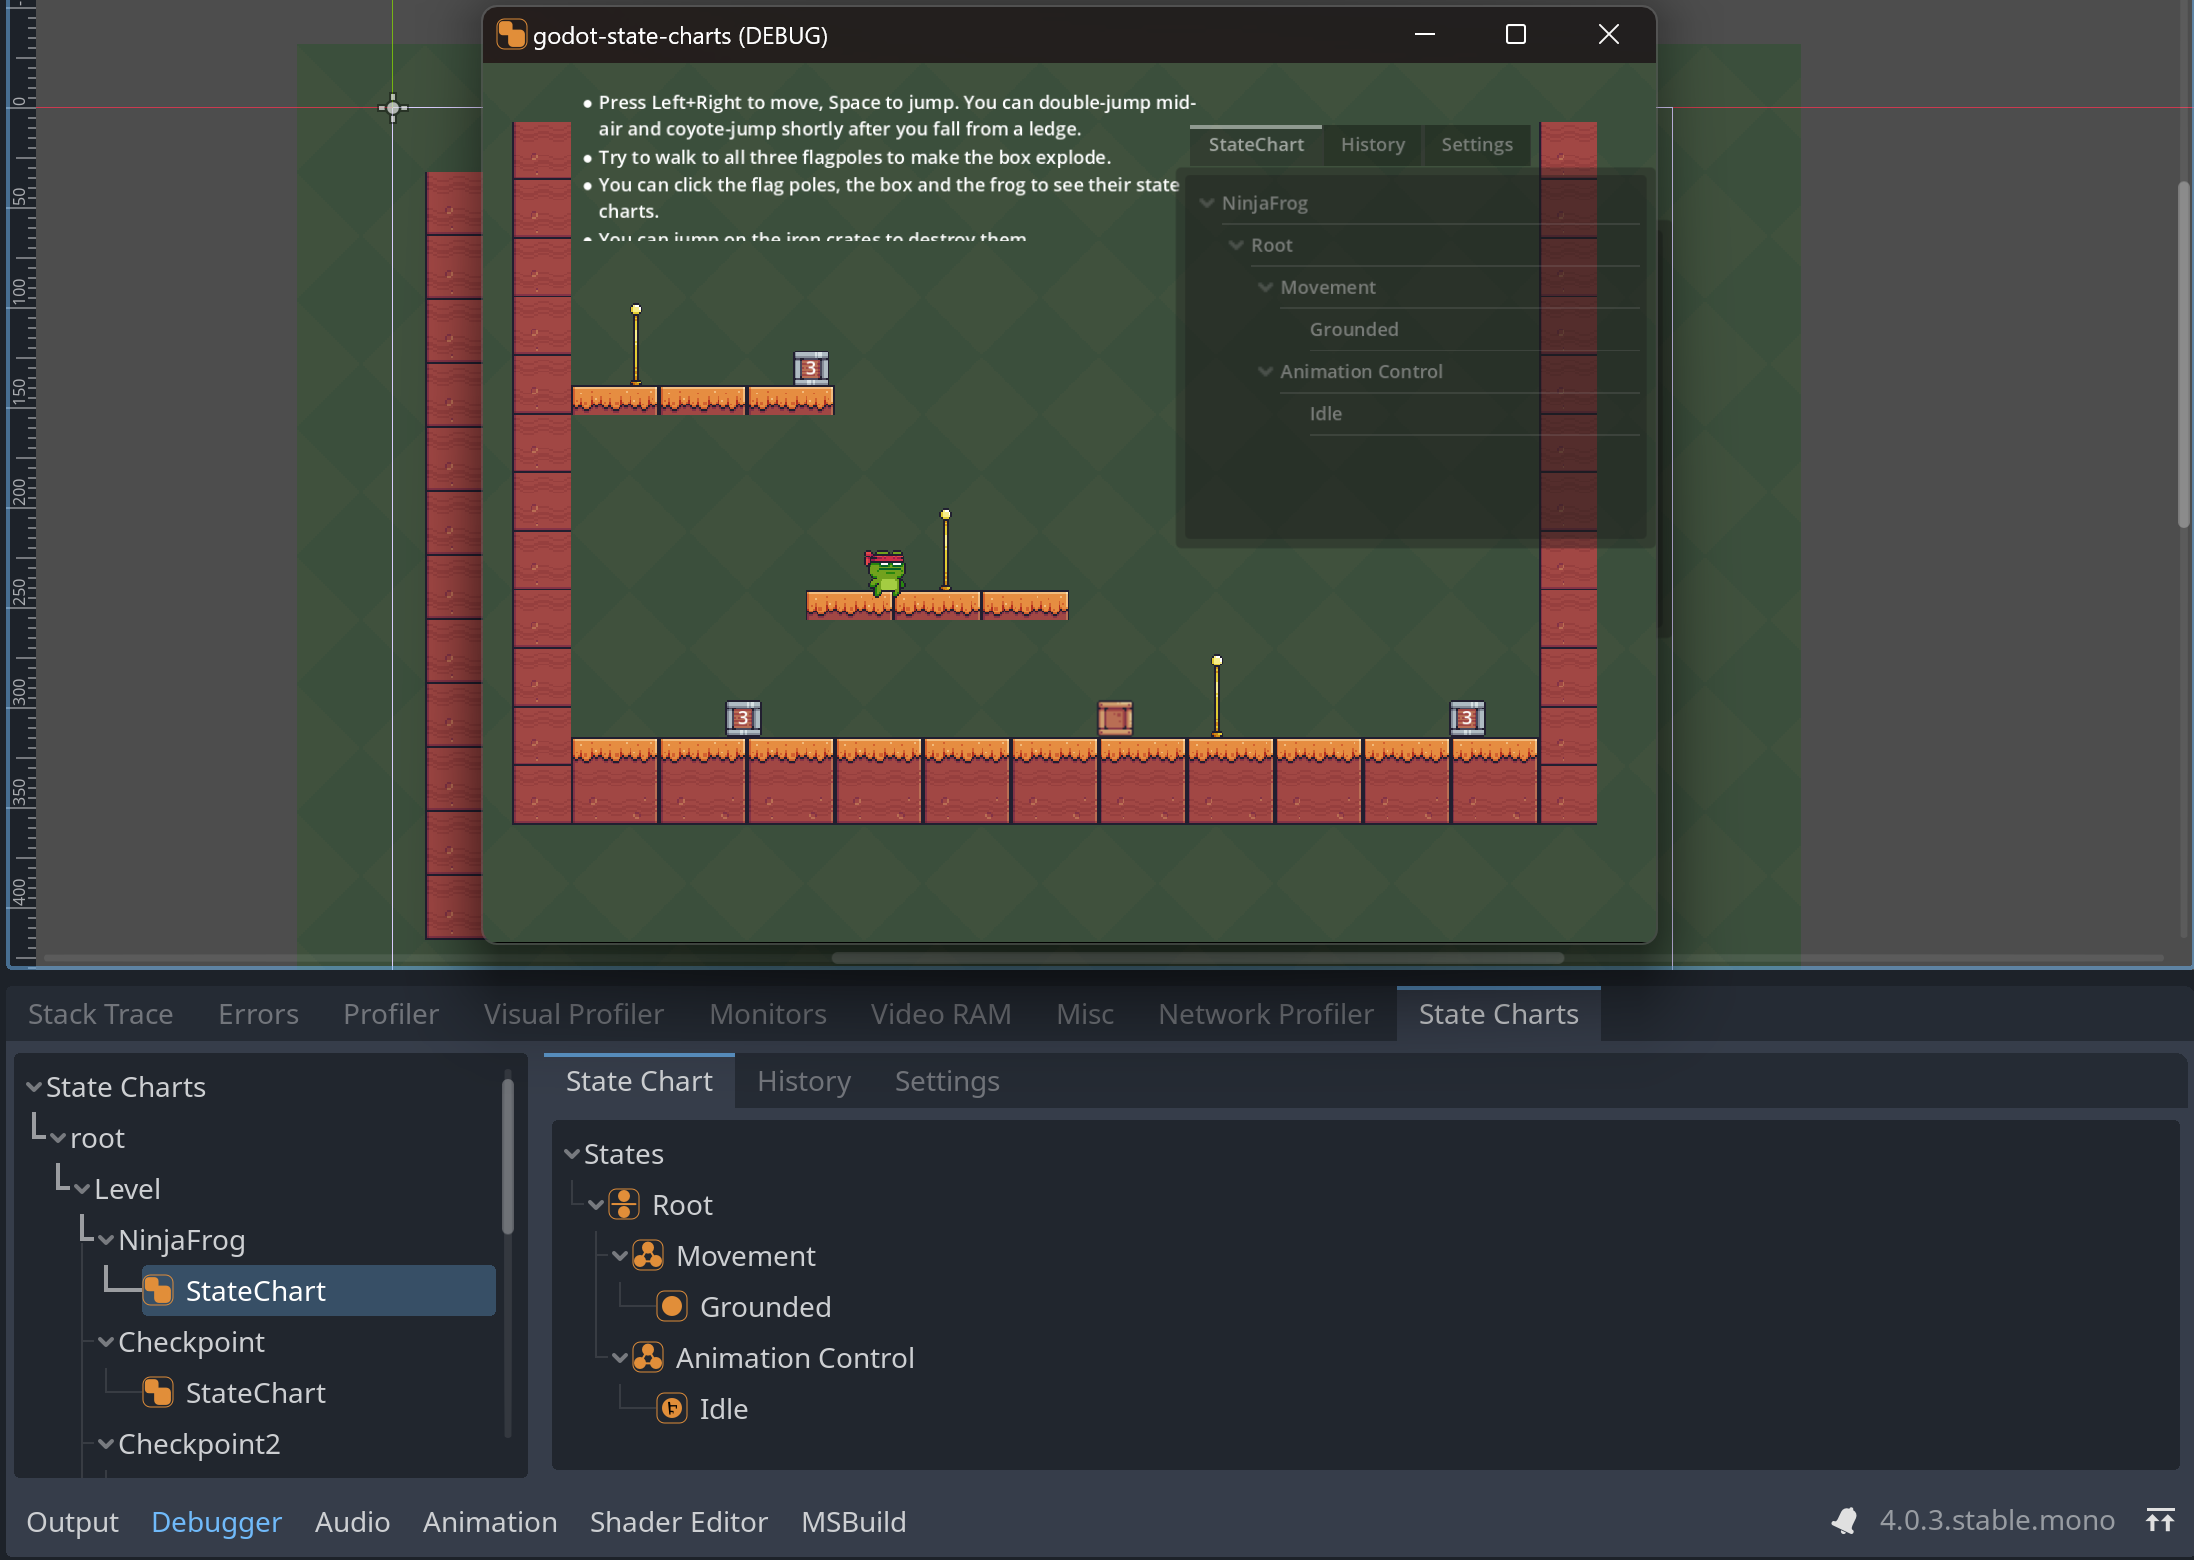
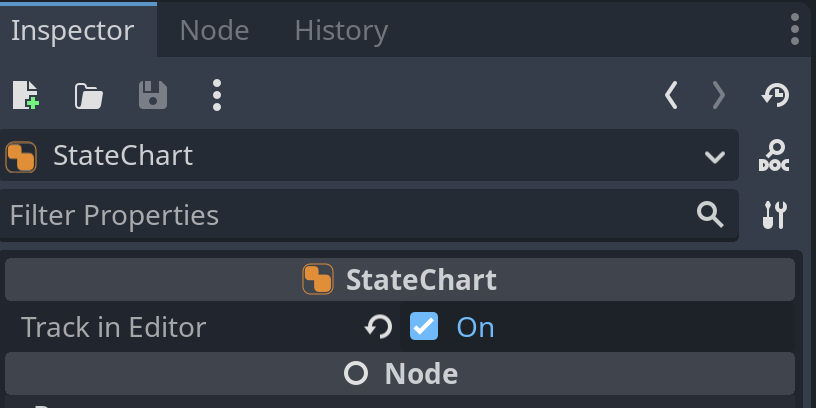
This feature is opt-in, so for a state chart to appear in the debugger, you need to set the Track in Editor property of the state chart to true.
Once this is set, the state chart will appear in the in-editor debugger when the game is running. From there you can select a state chart in the tree on the left and see its current state and history on the right. As with the in-game debugger you have flags to toggle whether events, state changes and transitions should appear in the history.
The in-editor debugger has some limitations compared to the in-game debugger:
- In general the in-editor debugger requires debug information sent from the game to the editor via a network connection. This takes longer and has a higher overhead than the in-game debugger which can directly access and display the state chart data. This means that the in-editor debugger will always slightly lag behind. It also limits how much information can be shown in the editor before the network connection gets overloaded.
- If you have a large amount of tracked state charts (eg. more than a few dozen) you will get warnings that the network connection is overloaded and the data displayed in the in-editor debugger will be incomplete or outdated. This is a fundamental limitation of the debugging process and unlikely to change in the future - there is only so much data a connection can handle.
- The feature is completely disabled when the game is not running from the editor. This means you cannot use it to remote-debug an exported game.
- You cannot see the expression properties as they would need to be serialized and sent over the network whenever they change, which adds a lot of overhead. Also some of the data may not be serializable at all.
- You cannot inject custom history entries into the history as the remote debugger has no public API. This feature would require a unified API for both the in-game and in-editor debugger which is currently not available and would introduce breaking changes.