Usage
Index
The plugin adds a new node type called State Chart. This node represents your state chart and is the only node that your code will directly interact with.
Below this node you can add the root state of your state chart, this will usually be a Compound State or a Parallel State. You can add as many states as you want to your state chart, but you can only have one root state. Below each state you can add Transition nodes. These nodes define the transitions between states. You can add as many transitions as you want to any state.
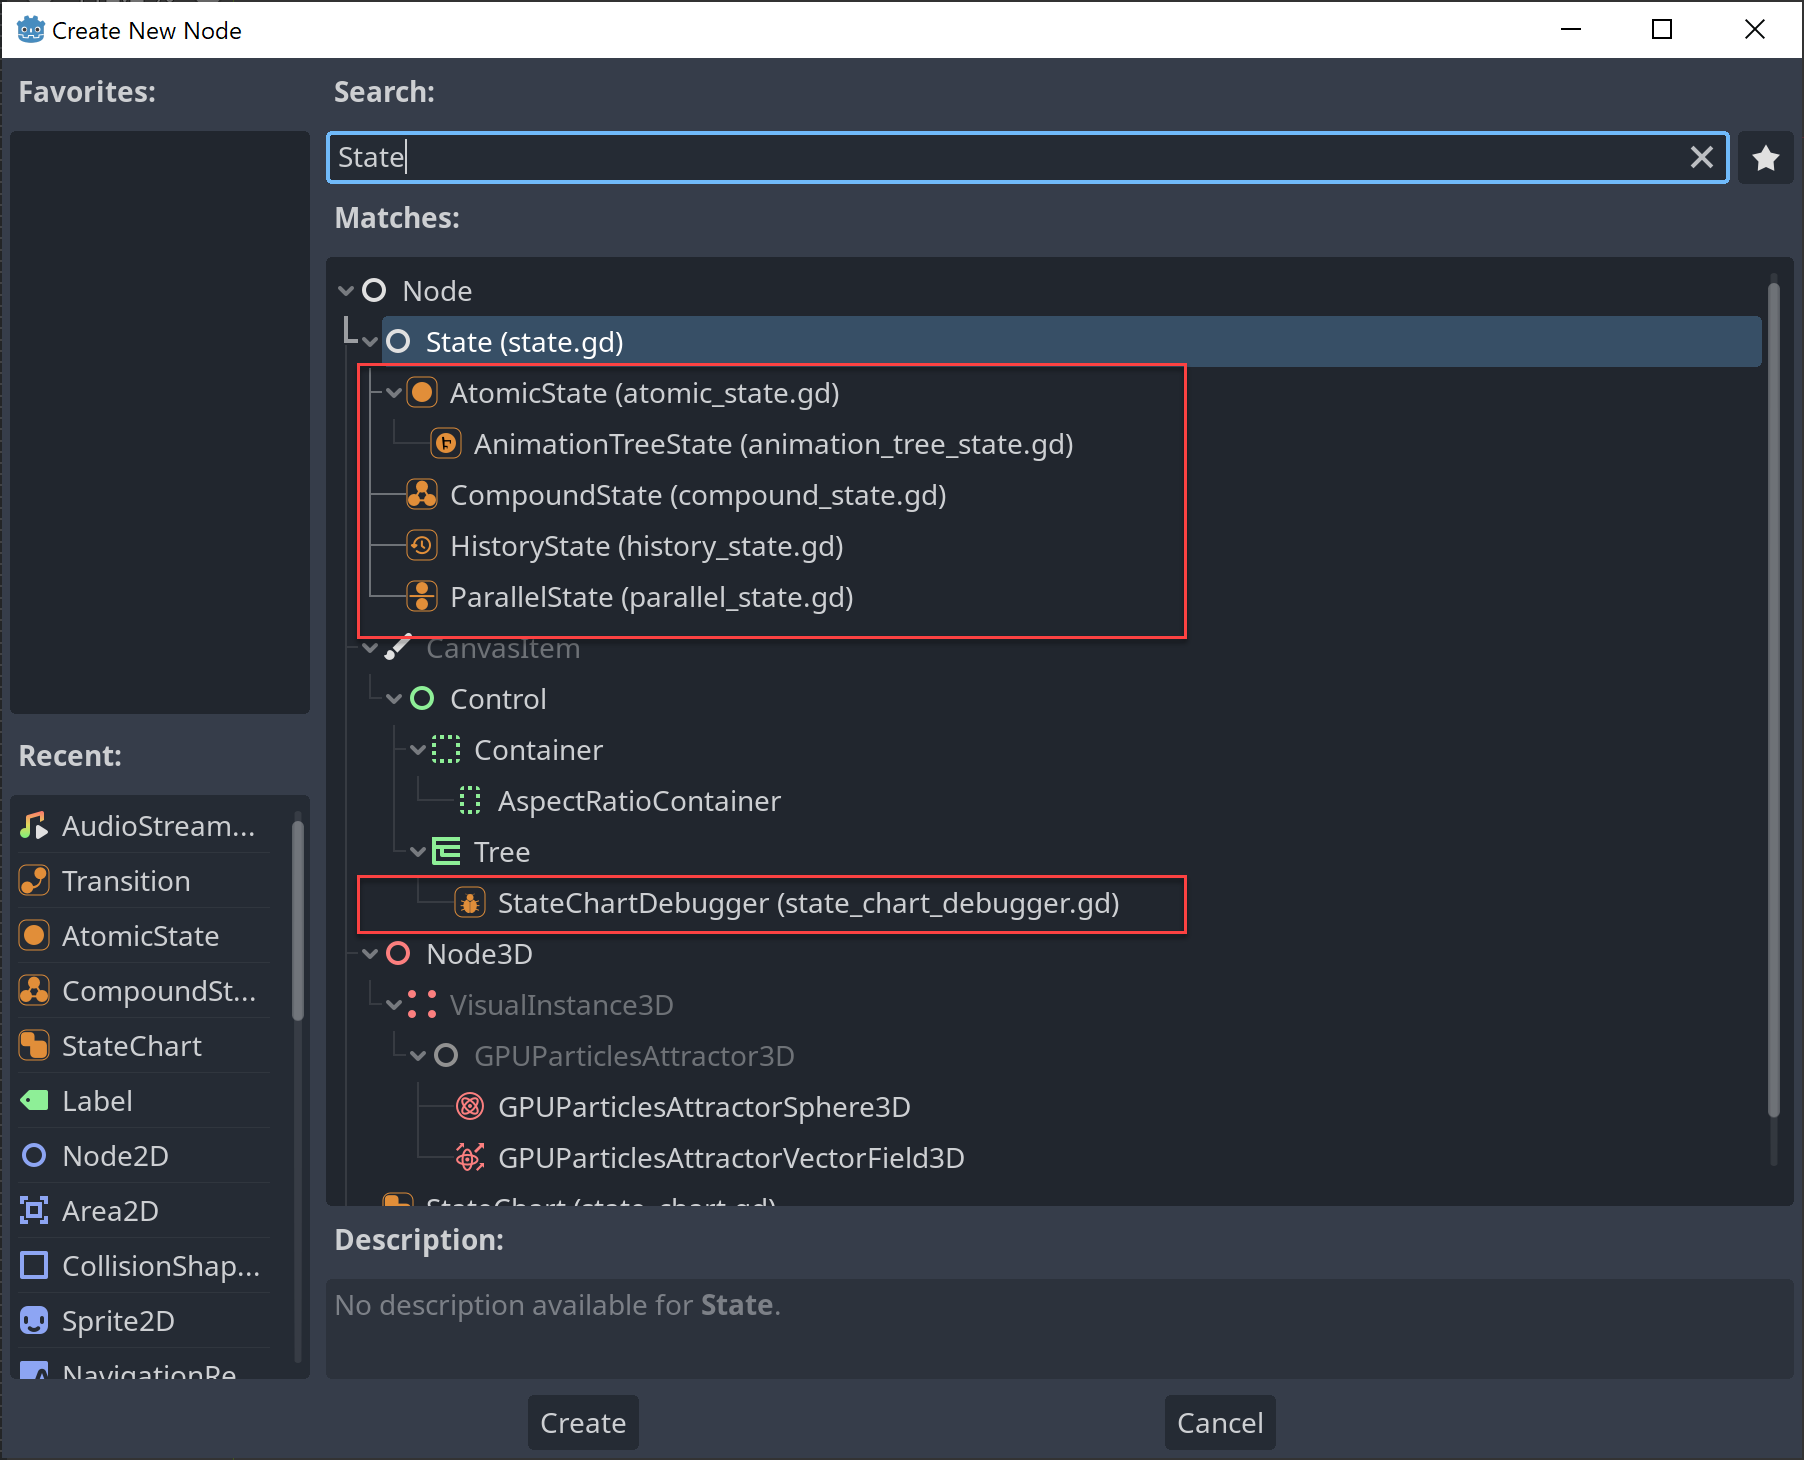
You can add nodes through the usual Add node dialog in Godot. Just type “state” or “transition” into the search field and you will see the nodes in the list.

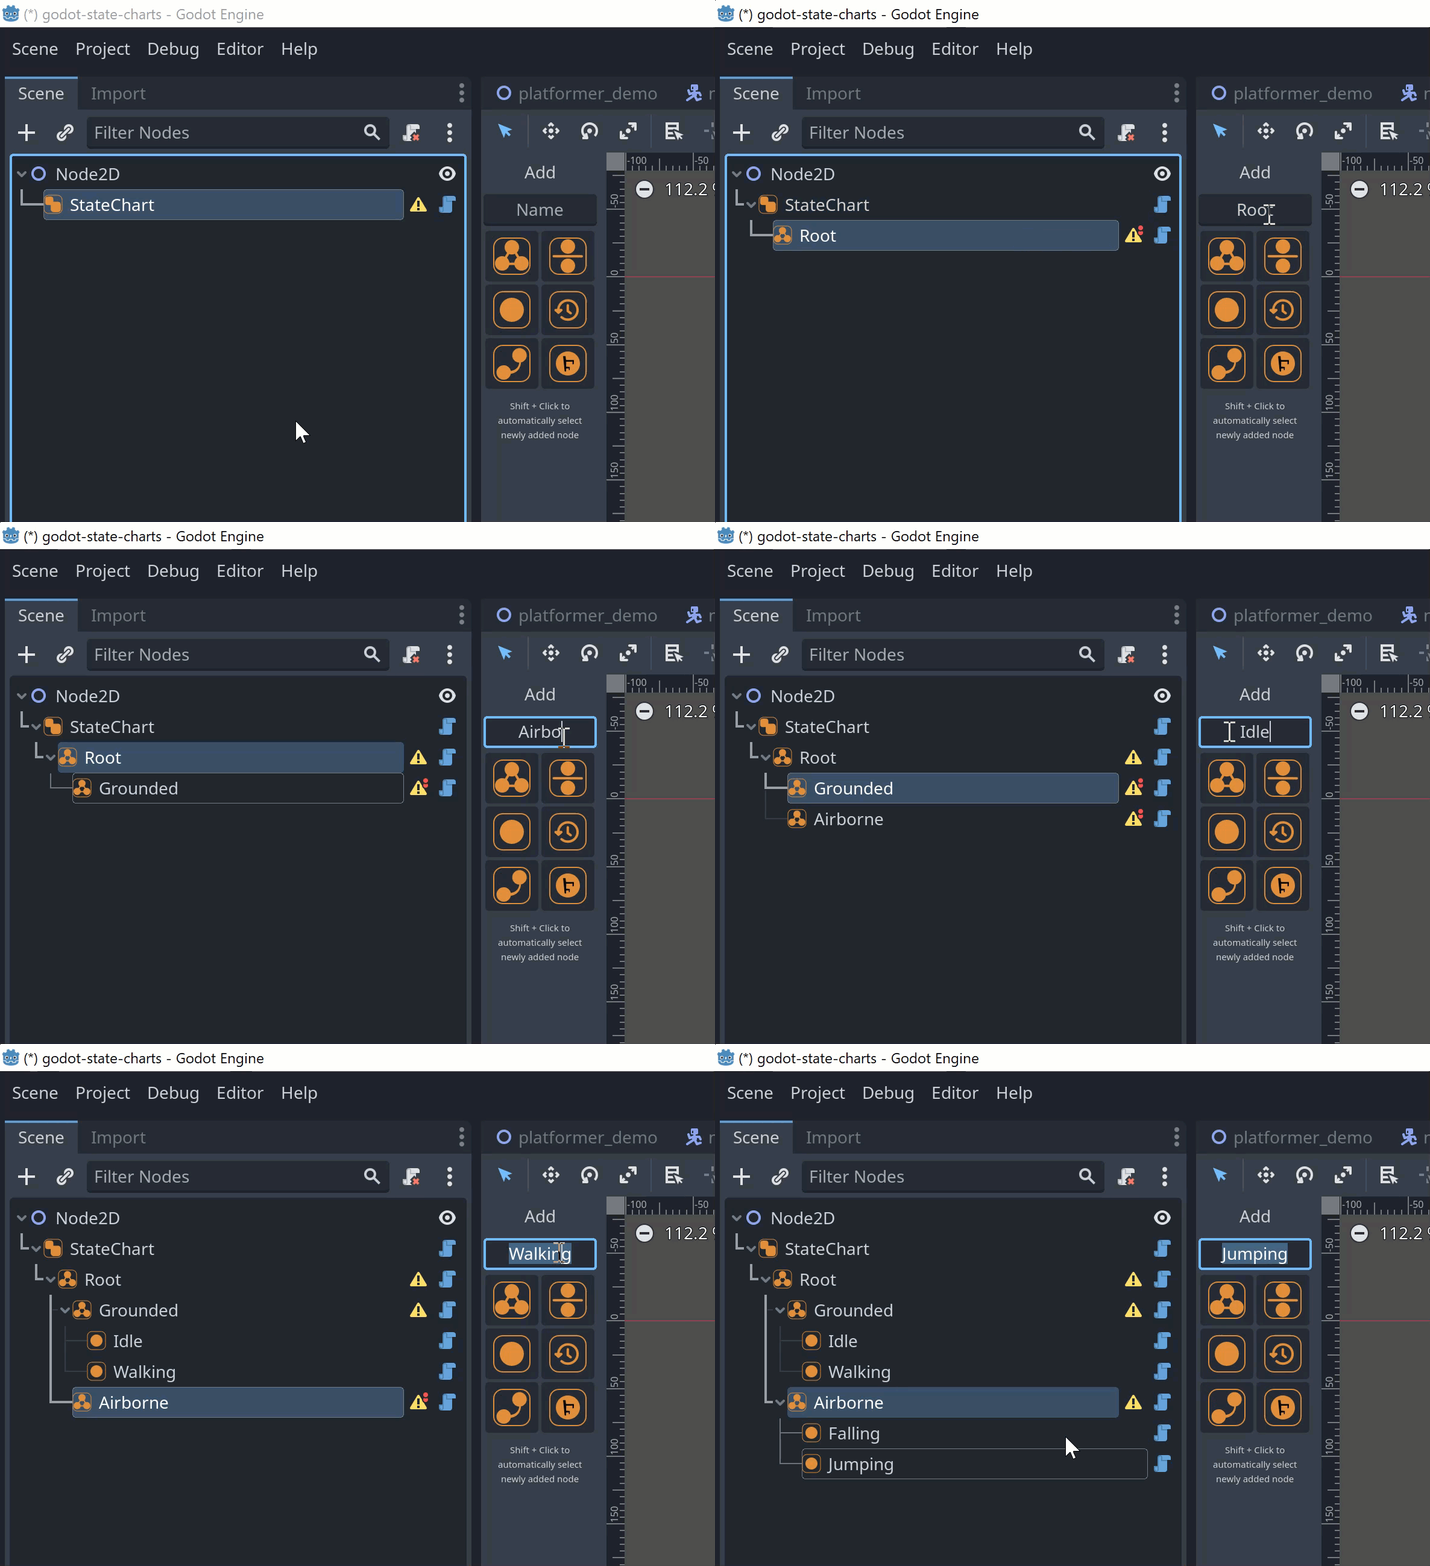
Starting with version 0.2.0 there is also an improved UI to quickly add nodes and transitions with a single click. The UI is displayed automatically when you select a state chart node to which nodes can be added:

If you hold down Shift while clicking the button for the node you want to add, the newly added node will be selected automatically. Otherwise the node will be added to the currently selected node but the currently selected node will stay selected.
The new UI supports undo/redo, so you can undo the addition of a node or transition with Ctrl+Z. You can move the sidebar to the other side of the editor by clicking the icon at the bottom of the sidebar.
Examples
The plugin comes with a few examples. You can find them in the godot_state_charts_examples folder. To run an example, open and run it’s main scene. The examples are:
ant_hill- a rudimentary ant hill simulation. The ants are controlled by a state chart that handles the different states of the ants such as searching for food, carrying food, returning to the nest, etc. This example shows how state charts can simplify a lot of the if-else logic that is often needed to implement AI.automatic_transitions- an example that shows how to use automatic transitions that react to changes in expression properties.cooldown- an example on how to drive UI elements with thetransition_pendingsignal. See also the section on delayed transitions for more information.csharp- an example on how to use the API from C#. Note that you need to use the .NET version of Godot 4 for this example to work. See also the section on installation with C# for more information.history_states- an example that shows how you can use history states to implement a state machine that can remember the last active state of a compound state.order_of_events- an example state chart to explore in which order events are fired. See also the appendix for more information.performance_test- this example is a small test harness to evaluate how larger amounts of state charts will perform. It contains a state chart instate_chart.tscnwhich you can adapt to match your desired scenario. The actual performance will depend on what callback signals you will use so you should adapt the state chart instate_chart.tscnto match your scenario. Then there are scenes namedten_state_charts.tscn,hundred_state_charts.tscnandthousand_state_charts.tscnwhich each contain 10, 100 or 1000 instances of the state chart fromstate_chart.tscn. You can run these scenes to see how many instances of the state chart you can run on your machine. Use the profiler to see how much time is spent in the state chart code.platformer- a simple platformer game with a state chart for the player character that handles movement, jumping, falling, double jumps, coyote jumps and animation control. This example shows how state charts can massively simplify the code needed to implement a full player character controller. The character controller code is less than 70 lines of code.random_transitions- an example how to use expressions to randomly transition between states and controlling the length of transition delays.stepping- an example on how to use stepping mode in a turn-based game. See also the section on stepping mode for more information.